Product Growth Experiments Part 2: Analysis
This is the second post about product growth experiments and it will focus on analysis.
If you landed here for the first time, I encourage you to read the previous post first: Product Growth Experiments Part 1: Concept and Hypothesis.

So, you have the hypothesis, tracking plan, pre-test analysis, and coded experiment, which is already running. That’s a lot, and you should be commended for your work so far. However, you need to know how to do the math so you won’t ruin all the great work you’ve done up to this point.
The main questions you might have here are:
- When should I stop the experiment?
- How can I be sure I can trust the results?
- Should I roll the winning experiment on to production?
Unfortunately, relying solely on the recommendations from your experimentation tool might not be good for your business. The reason for this is that, sometimes, even they are wrong when it comes down to analysis.
That’s why it’s crucial to know how to analyze experiment results on your own and validate anything a third-party tool recommends to you. Below, we’ll tackle both the theory and practice, and how to use it in real cases.
When should I stop the experiment?
That’s a tricky question. To make the answer simple, you should stop the experiment when the variant you created is performing better than the current control version.
But that’s not very straightforward. Without applying various statistical methods, you’ll never be sure you’re decision is correct. By applying the process below, you can almost always be certain you’re doing the right thing.
The statistics I’m referring to here are a few basic parameters like p-value, statistical power, minimal detectable effect, and minimal sample size. The good thing is that you don’t need to do any calculations yourself. You just need to understand what each number tells you and how to use them with various free online calculators.
Two common errors you must avoid when analyzing experiment results
To make a valid business decision based on the experiment, you must ensure that you didn’t do either of these two mistakes. Without doing so, you might as well just flip a coin before making the decision – the result will be just as random.
The first mistake (loved by CXOs) is to call a test variant a winner whenever it is performing better for a few days in a row. This error happens when you’re observing an uplift when, in reality, there’s no change. In statistics, it’s called a false positive or type I error.
The main reason this is a mistake is due to the lack of statistical significance represented by a metric called the p-value. Simply speaking, the p-value reflects how wrong you are in your false observation. That’s why we want it to be as low as possible.
Usually, the rule of thumb says the p-value should be below 0.05, which stands for 95% confidence that you’re not wrong (95% statistical significance). This is the threshold you should aim for before you make any business decision.
Protip: P-Value gets more stable and significant when the sample size or uplift increases. So, if the test uplift is stable, you just need more data and patience.
The second mistake happens when you think that there’s no uplift and your experiment had no effect, when, in reality, there’s an uplift and you did a good job – you just don’t see it yet. This mistake in statistics is called a false negative or type II error.
Just like in the previous situation, there’s a metric that proves it’s not the case, and it is called statistical power. To keep things short, it’s a common guideline to wait for at least 80% of the statistical power.
Those two concepts might be overwhelming for people that have always hated math or statistics. Thankfully, there are some tools that combine both of the above and give you a better overview of whether your uplift is trustworthy. They’re called minimal detectable effects.
What are the minimal detectable effect and minimal sample size, and how can I use them?
Some of you already heard about the minimal sample size and the minimal detectable effect. We discussed them briefly in the previous article.
The minimal sample size (MSS) tells you the minimum number of visitors you need to have if you want to have a big enough sample size for the expected uplift. But how can you know what uplift you’ll have? In most cases, that is something you want to find out during the experiment. That’s why it’s more useful to calculate the minimum detectable effect.
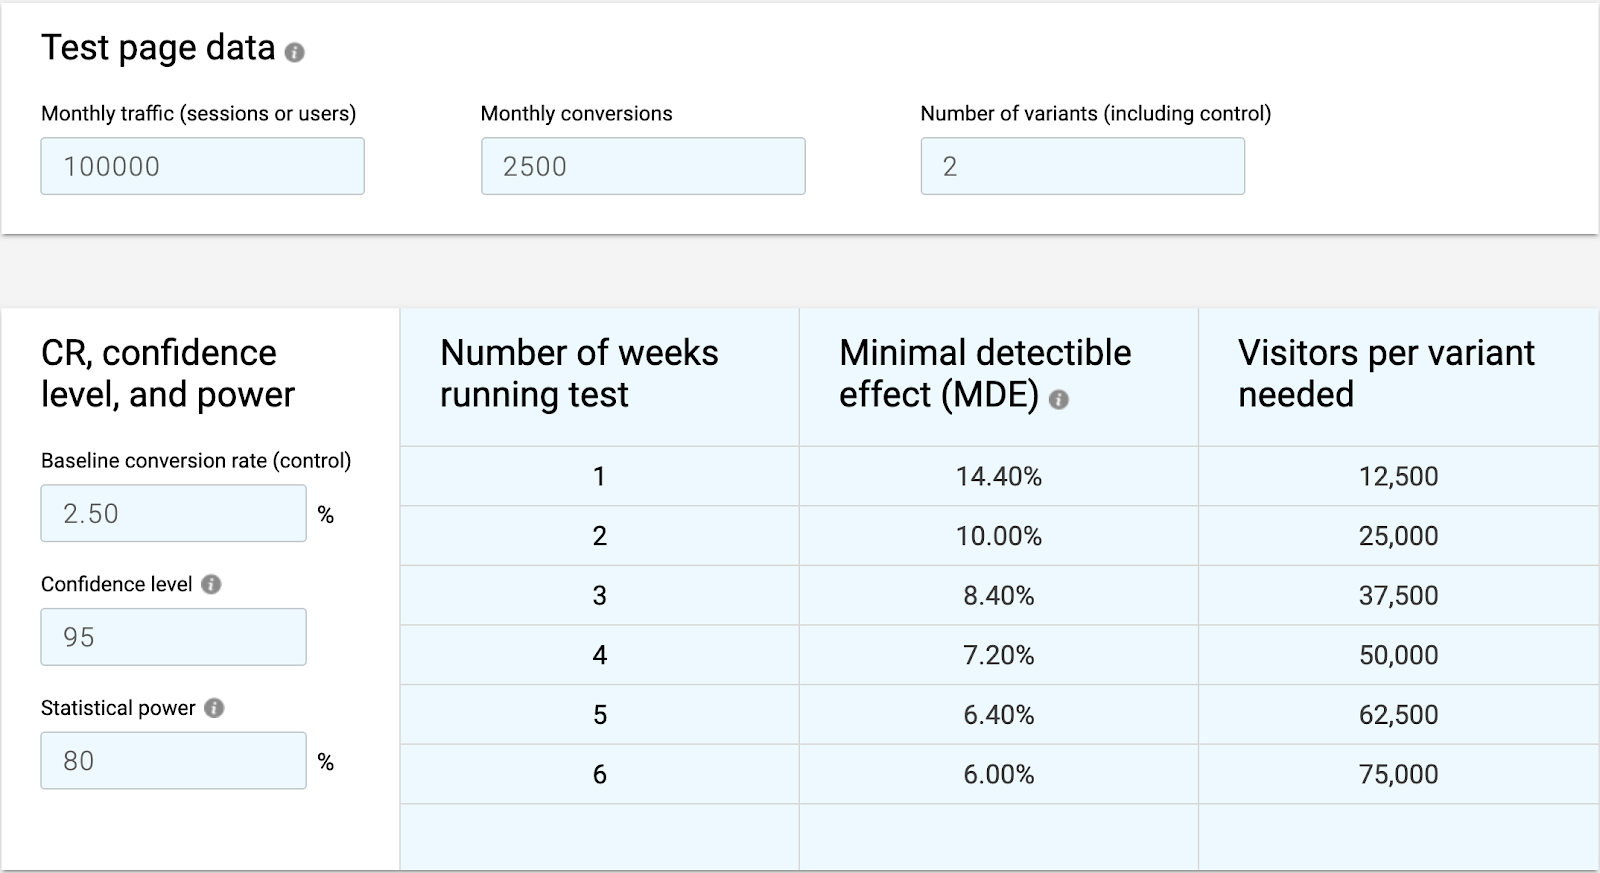
Simply speaking, the minimal detectable effect (MDE) takes your current traffic and conversion volumes to tell you what is the minimal improvement you need to observe to meet the required statistical significance and statistical power. It’s a useful tool, especially when you analyze the MDEs every week.
Why every week? Because the minimal detectable effect decreases the more data you get. That can easily be seen in, for instance, the CXL calculator.
That’s helpful because it allows you to:
- Do a pre-test analysis to determine right away if you have enough traffic/conversions to start a given experiment at all.
- Decide if your experiment results are valid after a week or two and you’re now ready to stop the experiment and roll it out.
- Check if your current uplift and traffic volume is high enough to consider rolling out the experiment.
Here’s the spreadsheet I use for calculating p-values, power, minimal detectable effect and minimal sample size.
3 extra tips that will make you a pro when approaching experiment analysis
Checking if you already met MDEs and if your results have enough statistical power and significance should give you enough confidence to make valid product and business decisions. However, these three pro-tips could help you get even more from your experiments.
Analyzing p-values on a timeline
You already know that p-value gets more stable and stronger the more data you have. That’s why in the first days/weeks it can change very rapidly and you can’t stop an experiment as soon as it reaches statistical significance.
MDE and the minimal sample size would cover that issue for you in most cases. However, there’s something extra you can do to understand your experimentation environment better: observing p-values on a timeline.
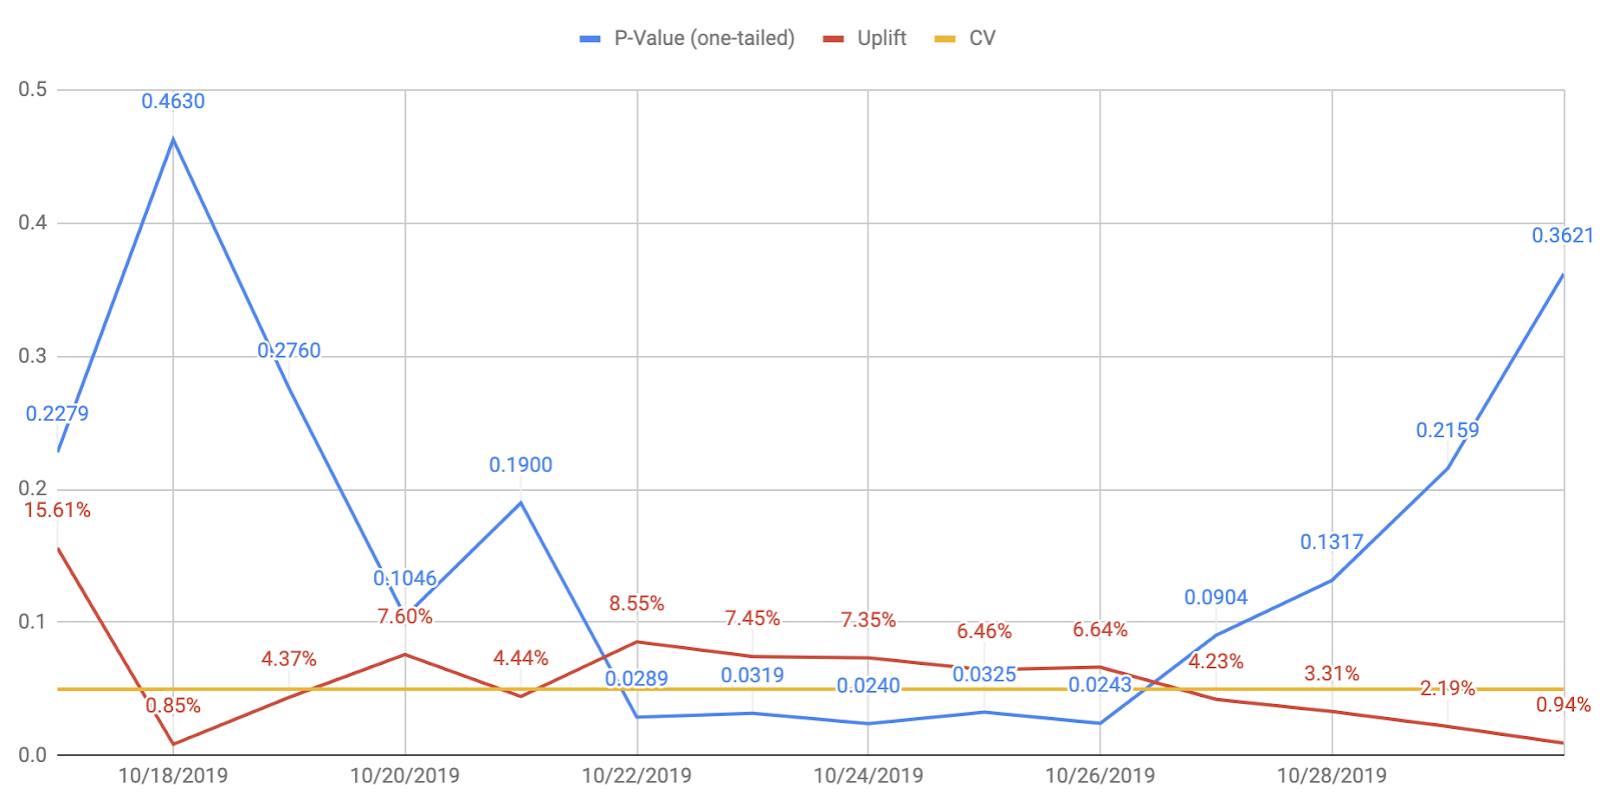
I used this spreadsheet to produce these charts. If you’re using Google Analytics to track experiment results, I suggest integrating GA and Spreadsheet via Supermetrics.
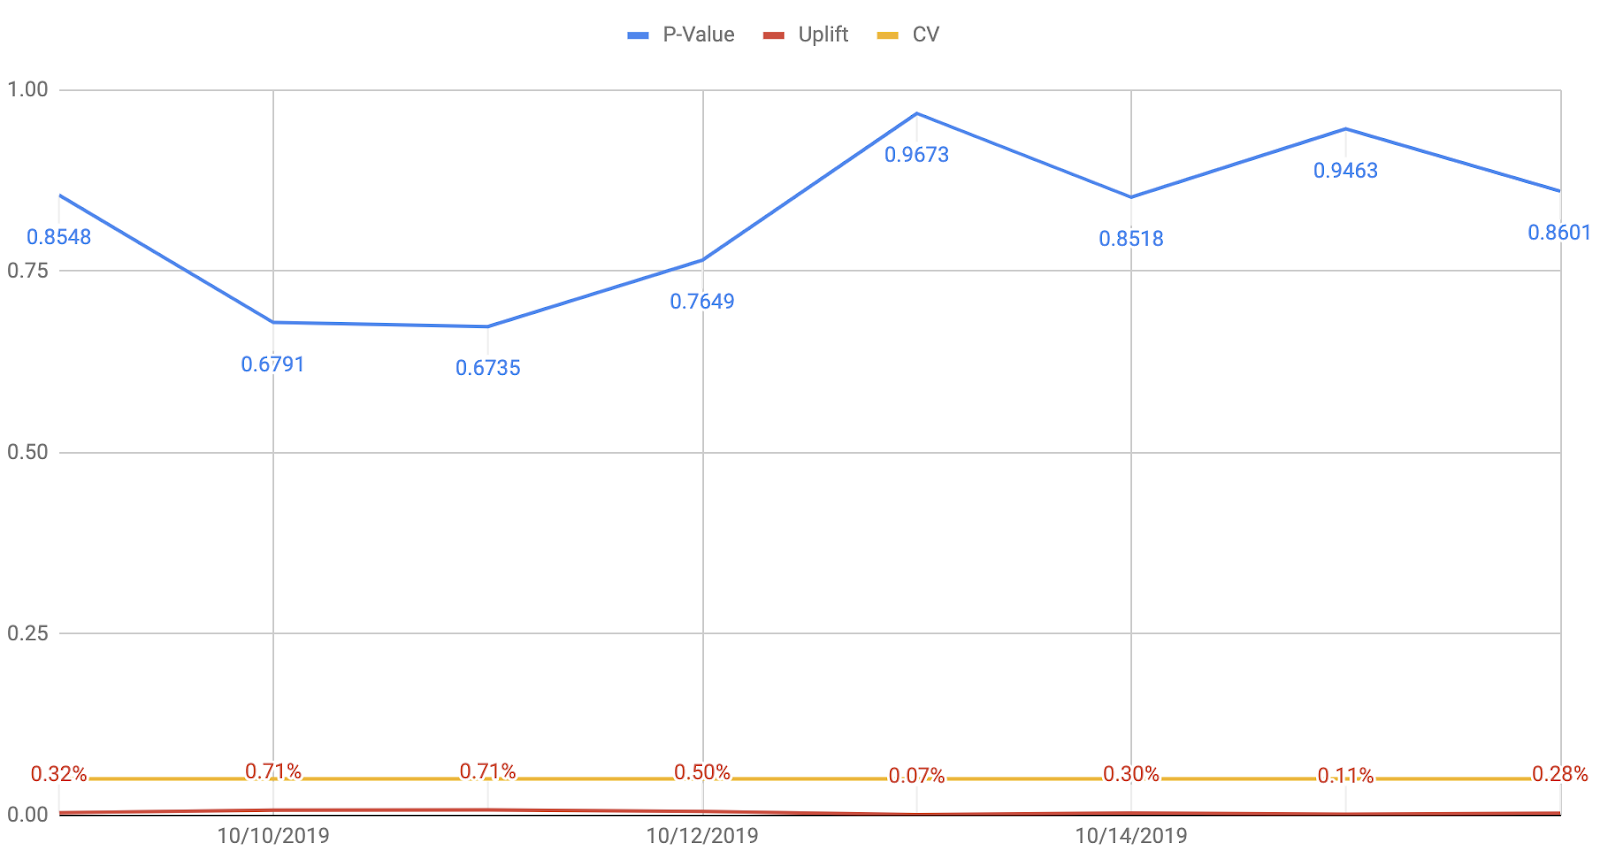
I took the two screenshots above from the reports of the experiments I did two months ago. The chart visualizes how the p-value (blue line) changes day by day. The red line is the uplift in conversion rates, and the yellow line is the statistical significance level set at 95%.
Imagine that after X months of experimenting, you have dozens of charts like these. You can find a common pattern among them to understand, let’s say, the experimentation environment. With that as your tool, you can make quicker decisions, namely, whether it’s time to stop inconclusive experiments or if it could still produce different results. Having charts like these available can save you a lot of time, money, and effort. After all, we’re not doing these experiments as part of a science project – we want them to positively impact the bottom line of our business.
More advanced use of this approach is explained in this Airbnb Engineering & Data Science blog post.
Tweak the results by segments, but do not look for significance there
One of the most important things you must do while analyzing experiments is to try to prove you and/or the data are wrong. That’s why it’s important to always look for outliers in your sample size. You can filter the results per different devices, browsers, resolutions, traffic sources, pricing plans, or other criteria that differentiate your user base.
Also, try to evaluate the experiment’s performance on each level of the funnel, not only on the final conversion rates. By doing that, you’ll learn 3X more from your experiments. They’ll either point you to the next hypothesis (e.g. on mobile some patterns could work 3X better when compared to desktop) or they will point you to a bug on a specific browser that decreased your overall uplift.
Sometimes, you might even find significance there. However, please keep in mind: in most cases, you won’t have a big enough sample size. Don’t fall into confirmation bias where you try to make your experiment win, no matter what. You’ll always find the significance somewhere, but that’s not the path you want to follow.
Do not treat an inconclusive or failed experiment as a useless one
Last but not least, it’s important to always learn something and gain insights from your failed or inconclusive experiments. It’s entirely possible that seven or eight experiments out of 10 will not bring you any uplifts.
I’d even say that you should get more insights from failed experiments. Every inconclusive test should be the starting point for the next hypotheses. Remember that finding out that a specific unique value proposition, trust symbol, tactic, or benefit that didn’t increase or decrease the conversion rate significantly still provides information that can be used in other areas of product development or experimentation.
What’s not documented will be lost next month
If you follow the above points when analyzing your experiments, you’re already doing better than the majority of companies I’ve seen and heard about. Congrats 💪
Now, it’s time to make sure that you don’t lose all that knowledge that has been gained next month. Believe me, lack of proper insights documentation will make your growth slow down.
We’ll talk about avoiding such a fatal situation in the third part of this article: Product Growth Experiments Part. 3: Documentation and Findings (it’ll be in the first week of February 2020). If you don’t want to miss the article, be sure to .